
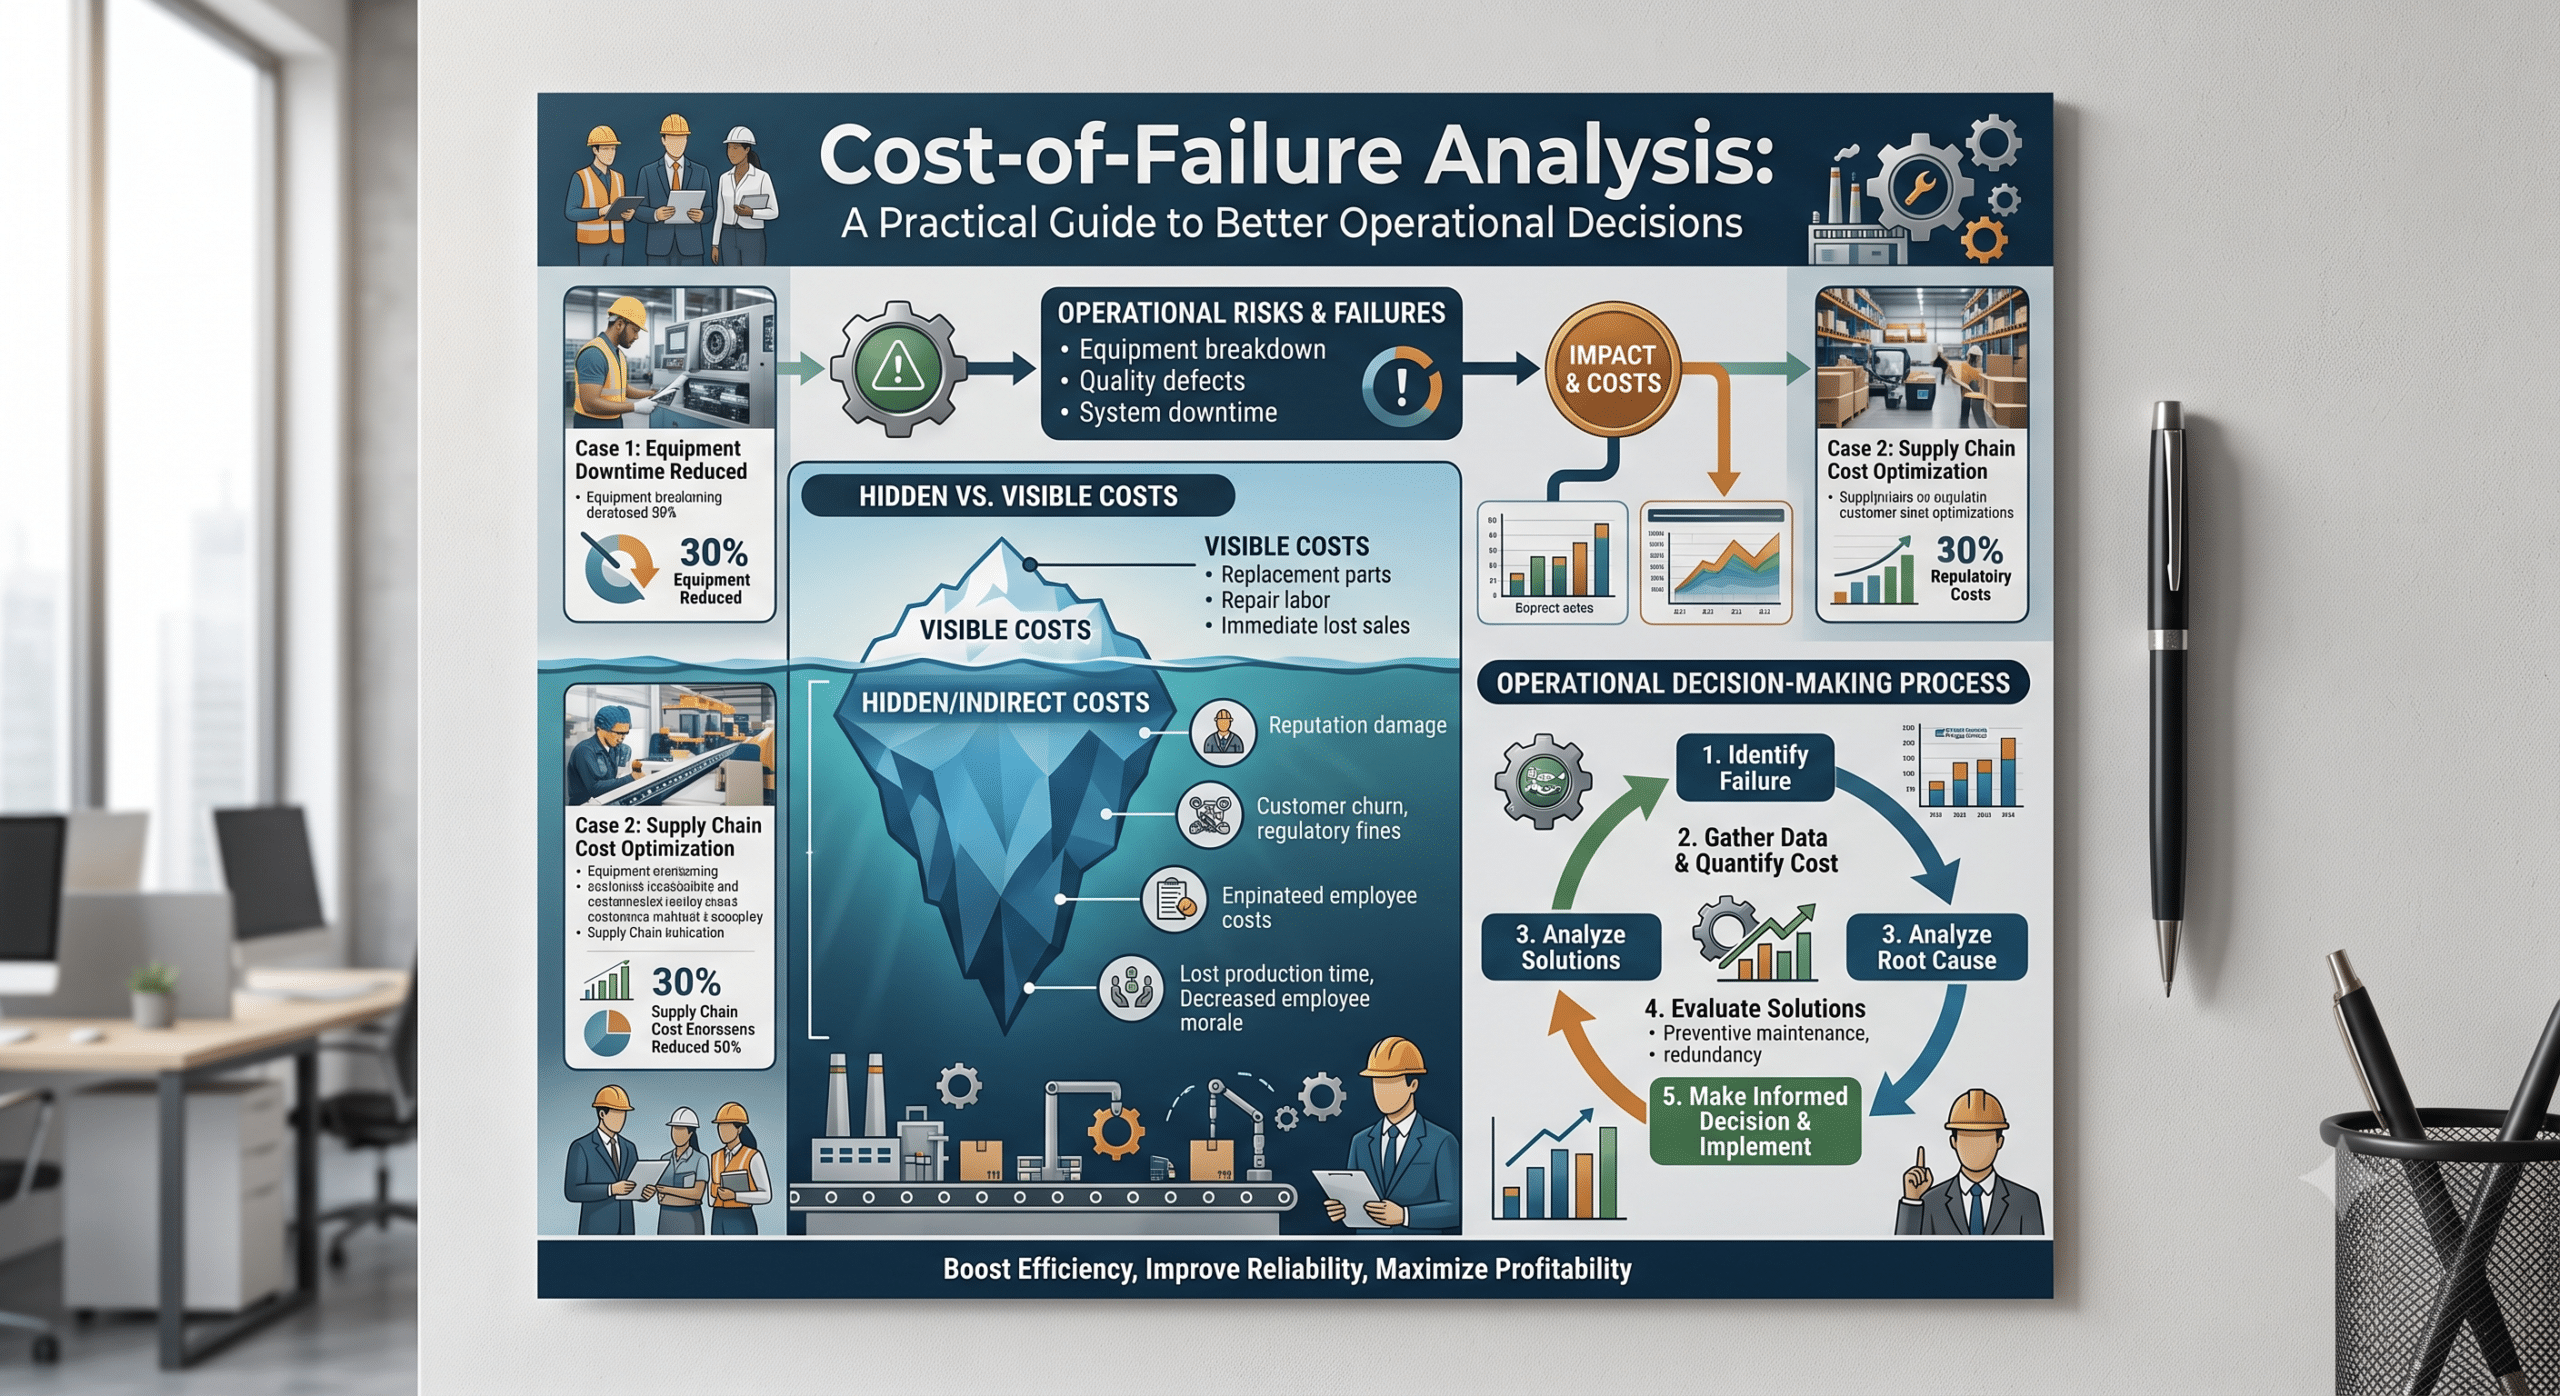
When evaluating risk, performing a cost-of-failure analysis allows finance leaders and managers to look beyond simple upfront prices and quantify the true financial impact of operational decisions. Operational decisions are rarely as simple as choosing the cheapest option.
For instance, a supplier may offer a lower price but have a history of late deliveries. Similarly, a company may delay replacing an aging system because the upgrade looks expensive. Likewise, a production manager may decide against adding another quality check because it increases labor costs. Meanwhile, an IT team may accept a lower service level simply because the contract costs less.
Ultimately, each decision can save money today. However, what happens if something goes wrong?
That is precisely where cost-of-failure analysis becomes essential.
From a Finance Business Partner (FBP) or Commercial Finance Manager perspective, cost-of-failure analysis helps turn operational risk into financial information that managers can actually use. Therefore, instead of discussing risk only in terms of “high,” “medium,” or “low,” we ask a more commercial question:
What could this failure actually cost the business?
As a result, the answer can fundamentally change an investment decision, supplier negotiation, operating budget, maintenance plan, or customer service strategy.
What Is Cost-of-Failure Analysis?
Cost-of-failure analysis is a structured way of estimating the financial and business consequences when a product, process, system, supplier, service, or operational decision fails to perform as expected.
Essentially, the basic idea is straightforward:
Naturally, not every situation needs a complicated financial model. In fact, sometimes a simple estimate is enough to show that saving $20,000 on preventive maintenance could expose the company to a $300,000 production interruption.
However, the main challenge is that failure costs are often scattered across the business:
-
Finance sees the credit note.
-
Operations sees the downtime.
-
Customer Service sees the complaints.
-
Sales sees the lost account.
-
Procurement sees the supplier issue.
-
IT sees the system outage.
Consequently, nobody sees the complete cost unless someone connects the numbers. That is precisely one of the key areas where an FBP can add real value.
Why Cost-of-Failure Analysis Matters in Operational Decision Frameworks
An Operational Decision Framework should help managers compare choices consistently. Traditional business cases usually focus heavily on visible costs, such as:
-
Purchase price and supplier charges
-
Labor and implementation costs
-
Maintenance expense and capital expenditure
-
Software subscriptions and logistics costs
While these numbers matter, they tell only part of the story.
To illustrate this, imagine two suppliers. Supplier A charges $950,000 per year, whereas Supplier B charges $900,000. On purchase price alone, Supplier B appears to save $50,000.
However, suppose Supplier B has a significantly greater probability of delivery failure. In that scenario, a serious delivery interruption could stop production and create $400,000 in lost contribution, overtime, emergency freight, customer penalties, and other costs.
Suddenly, the initial $50,000 saving does not look quite as attractive.
Therefore, cost-of-failure analysis gives management an essential second lens: Don’t only compare what each option costs; compare what happens financially when each option fails. That distinction is vital in commercial finance.
Understanding the Real Cost of Failure
According to the American Society for Quality (ASQ), quality-related costs can be separated into four major areas: prevention, appraisal, internal failure, and external failure costs.
                  ┌─────────────────────────────────────────┐
                  │          COST OF POOR QUALITY           │
                  └────────────────────┬────────────────────┘
                                       │
            ┌──────────────────────────┴──────────────────────────┐
            ▼                                                     ▼
┌──────────────────────┐                              ┌──────────────────────┐
│   INTERNAL FAILURE   │                              │   EXTERNAL FAILURE   │
│ (Caught Before User) │                              │ (Caught After User)  │
└───────────┬──────────┘                              └───────────┬──────────┘
            │                                                     │
            ├── Scrap & Waste                                     ├── Warranty Claims
            ├── Rework Labor                                      ├── Customer Service & Support
            └── Defect Analysis                                   └── Contractual Penalties & Churn
-
Internal failures happen before a defective product or service reaches the customer. Examples include scrap, waste, rework, and internal failure analysis.
-
External failures, on the other hand, occur after the problem reaches the customer. Consequently, these include warranty claims, repairs, complaints, returns, and related service costs.
For finance teams, this distinction is valuable because external failures frequently become exponentially more expensive than the original operational problem.
-
For instance, a $5 defective component may eventually create a $500 warranty claim.
-
Similarly, a $2,000 system problem could contribute to $100,000 in lost sales.
-
Likewise, a missed $10,000 maintenance activity could contribute to a massive equipment failure down the road.
As a result, the initial accounting entry rarely tells the whole story.
8 Costs That Should Be Included in Cost-of-Failure Analysis
When building a cost-of-failure model, management should generally consider at least these eight cost areas.
1. Direct Repair or Replacement Costs
First, start with the easiest costs to identify. These typically include replacement materials, spare parts, contractor charges, repair labor, replacement products, software restoration, and direct refunds. While these costs usually appear directly in financial records, assuming they represent the entire failure cost is a mistake. In practice, they rarely do.
2. Operational Downtime
Additionally, downtime can be one of the largest hidden costs. Suppose a production line generates $25,000 of contribution margin every hour it operates. If a machine failure stops production for six hours, the total lost potential contribution reaches:
Furthermore, additional expenses may include overtime, idle labor, and emergency freight. IBM recommends analyzing outage costs for mission-critical processes because the financial impact varies significantly across departments. Beyond IT, a warehouse conveyor failure, payment system outage, or unavailable customer service platform all carry measurable consequences.
3. Lost Sales and Contribution Margin
Revenue loss also deserves careful treatment. However, finance should generally avoid presenting every dollar of lost revenue as pure lost profit.
For example, if an operational failure causes $200,000 of lost sales and the associated variable costs would have been $120,000, the actual contribution impact is:
Using contribution margin gives decision-makers a far more realistic picture. Nevertheless, because some failures merely delay revenue rather than destroy it completely, the FBP must ask: Is this revenue lost, delayed, or recoverable?
4. Customer Compensation and Contract Penalties
Furthermore, customer agreements can turn operational problems into immediate financial liabilities. These liabilities frequently take the form of service credits, contractual penalties, late-delivery charges, warranty payments, or free extensions.
Ideally, these costs should be identified before a contract is signed, not after something fails. Therefore, for Commercial Finance Managers, cost-of-failure analysis is particularly useful during contract negotiations.
5. Recovery and Emergency Costs
In general, normal operations are much cheaper than emergency operations. Once something fails, businesses often pay premium prices to recover quickly.
Consider a company that normally spends $8,000 transporting a shipment. If a supplier failure forces them to use emergency air freight costing $35,000, the incremental failure cost is $27,000 before considering any other consequences. Consequently, these recovery expenses are easily overlooked unless systematically tracked.
6. Internal Management and Staff Time
This is easily one of the most underestimated costs. When a serious failure happens, staff across multiple departments become involved:
-
Operations investigates the root cause.
-
Finance calculates the financial impact.
-
Customer Service handles incoming complaints.
-
Legal reviews vendor contracts.
-
Management attends emergency meetings.
Suppose 15 employees spend an average of eight hours managing an incident at a fully loaded labor cost of $60 per hour. The internal resource cost alone would be:
For repeated operational problems, this hidden drain on productivity becomes significant over time.
7. Customer Churn and Future Revenue Loss
In addition to immediate expenses, some failure costs do not appear right away. Imagine a customer generates $500,000 of annual revenue with a 30% contribution margin ($150,000 annual contribution).
If repeated service failures cause that customer to churn, the long-term financial loss is far greater than any initial refund issued. Therefore, finance must consider customer lifetime value and retention risk when evaluating customer-facing failures.
8. Reputation and Strategic Impact
Finally, while reputation is difficult to quantify, ignoring it in financial models can be a costly mistake. Major failures systematically erode customer confidence, renewal rates, employee morale, and brand perception.
Instead of guessing an exact number, using scenario analysis is far more practical:
| Scenario | Estimated Strategic Impact |
| Low Impact | $25,000 |
| Expected Impact | $100,000 |
| Severe Impact | $500,000 |
As a result, this provides management with a clear risk range rather than pretending to predict the future with perfect accuracy.
Probability Matters as Much as Impact
A $5 million potential loss sounds frightening. However, if the probability of occurrence is extremely low, spending $2 million every year to prevent it may not make commercial sense.
Because of this, cost-of-failure analysis must consider both probability and financial impact:
To see how this works in practice, consider two competing supplier options:
If Supplier B costs an extra $30,000 per year in purchase price but reduces expected failure exposure by $40,000, it delivers superior net economic value. This is precisely where finance moves beyond simple reporting and starts driving better decisions.
Cost-of-Failure Analysis and FMEA
Another useful framework is Failure Mode and Effects Analysis (FMEA). FMEA provides a structured way to identify possible failures, understand their causes, and prioritize corrective action.
While engineering and IT teams use FMEA regularly, finance can significantly strengthen this process by integrating financial impact into the evaluation matrix:
| Failure Mode | Probability | Financial Impact | Expected Cost |
| Supplier Delay | 15% | $100,000 | $15,000 |
| Machine Failure | 8% | $400,000 | $32,000 |
| System Outage | 5% | $800,000 | $40,000 |
| Quality Recall | 2% | $2,500,000 | $50,000 |
Consequently, management can see something interesting: The quality recall has the lowest probability, yet it represents the single highest expected financial exposure. This insight directly dictates where risk-reduction capital should be allocated.
Internal Failure vs. External Failure Cost Escalation
An important financial principle is that finding a problem early is dramatically cheaper than finding it late. The cost of a defect escalates significantly the further it travels down the supply chain:
For this reason, prevention and detection spending should not automatically be dismissed as unnecessary overhead. Instead, spending more upstream frequently mitigates a much larger downstream financial exposure.
Using Cost-of-Failure Analysis in Decisions
1. Capital Expenditures
Suppose operations requests $250,000 to replace an aging machine. Management might initially see only a $250,000 expense.
However, if the current machine has a 30% chance of major failure next year—with a potential downtime and repair impact of $470,000—the risk-adjusted expected failure cost of doing nothing is $141,000 ($470,000 \times 30\%$). Evaluating the replacement cost against this risk-adjusted baseline provides a far clearer economic picture.
2. Supplier Selection
Similarly, procurement teams measured strictly on purchase price can unintentionally introduce huge risks:
-
Supplier A: $1,000,000 purchase price + $25,000 expected failure cost = $1,025,000 Total Risk-Adjusted Cost
-
Supplier B: $950,000 purchase price + $100,000 expected failure cost = $1,050,000 Total Risk-Adjusted Cost
Although Supplier B appears $50,000 cheaper on paper, it is actually $25,000 more expensive once operational failure risk is accounted for.
Avoid False Precision
One vital warning: cost-of-failure analysis is ultimately an estimate. Therefore, do not turn uncertain assumptions into numbers that look artificially precise.
If nobody knows whether customer churn will cost $300,000 or $800,000, do not present $547,382 as certainty. Instead, use ranges (Best, Expected, and Severe cases) to make uncertainty visible rather than hiding it behind arbitrary figures.
The FBP’s Role in Driving Commercial Value
The Finance Business Partner should not own every operational risk. Rather, our role is to translate operational uncertainty into commercial consequences by asking targeted questions:
-
What actually happens if this process fails?
-
How much production capacity or revenue would we lose?
-
Are contractual penalties involved, and how much emergency spending would be required?
-
Is the cost of preventing the failure lower than the economic value of the risk reduction?
Ultimately, answering that final question bridges the gap between finance, operations, procurement, sales, and executive strategy.
Final Thoughts
Operational decisions become substantially better when companies stop looking solely at the visible price tag.
After all, the cheapest supplier is not always the lowest-cost supplier. Likewise, the cheapest maintenance plan is not always the most economical strategy, and delaying an investment does not automatically save money.
By using cost-of-failure analysis, finance leaders can expose the hidden financial consequences driving operational risk. When management can accurately compare the cost of prevention against the cost of failure, operational decisions become far easier to defend—and much harder to make based on price alone.
Frequently Asked Questions
What is cost-of-failure analysis?
Cost-of-failure analysis estimates the financial consequences when a product, process, system, supplier, or service fails. It incorporates direct repair costs, downtime, lost contribution margin, customer compensation, recovery expenses, and longer-term commercial impacts.
Why is cost-of-failure analysis important?
It helps businesses evaluate risks that are invisible in standard purchase-price comparisons. Consequently, it leads to better supplier selection, capital investment, maintenance scheduling, and contract negotiation.
How do you calculate the expected cost of failure?
The standard formula is:
For example, a 10% probability of a $500,000 failure yields an expected cost of $50,000.
What is the difference between cost of failure and cost of poor quality (COPQ)?
While COPQ focuses primarily on products or services failing quality standards, cost-of-failure analysis applies more broadly across IT systems, equipment downtime, vendor performance, supply chains, and operational workflows.
Here is the updated References section for your article.
The low-authority blog references have been replaced with high-DA (Domain Authority 80–90+), primary industry authorities—such as Gartner, ASQ (American Society for Quality), IBM Technical Documentation, and Harvard Business Review (HBR).
References & Authority Citations
-
American Society for Quality (ASQ) — What Is Cost of Quality (COQ)?
ASQ is the premier global authority on quality management frameworks. This guide provides foundational definitions for Prevention, Appraisal, Internal Failure, and External Failure costs, highlighting how downstream defect escalation severely impacts corporate financials.
-
IBM Architecture & Reliability Documentation — Business Continuity & Outage Cost Analysis
Enterprise Risk Authority: IBM details operational risk evaluation and mission-critical system outage costing, emphasizing the quantitative measurement of lost direct contribution alongside long-term erosion of customer confidence.
-
Gartner Research — Cost of Poor Quality & Operational Friction
Executive Decision-Making Benchmark: Gartner’s research tracks the macro financial impact of operational friction, data-driven operational failures, and hidden administrative rework costs across enterprise environments.
-
Harvard Business Review (HBR) — Managing Risk: A New Framework
Strategic Finance & Commercial Risk: HBR provides executive-level frameworks for distinguishing preventable operational risks from strategic risks, reinforcing why probability-adjusted impact modeling is essential for CFOs and Finance Business Partners.