
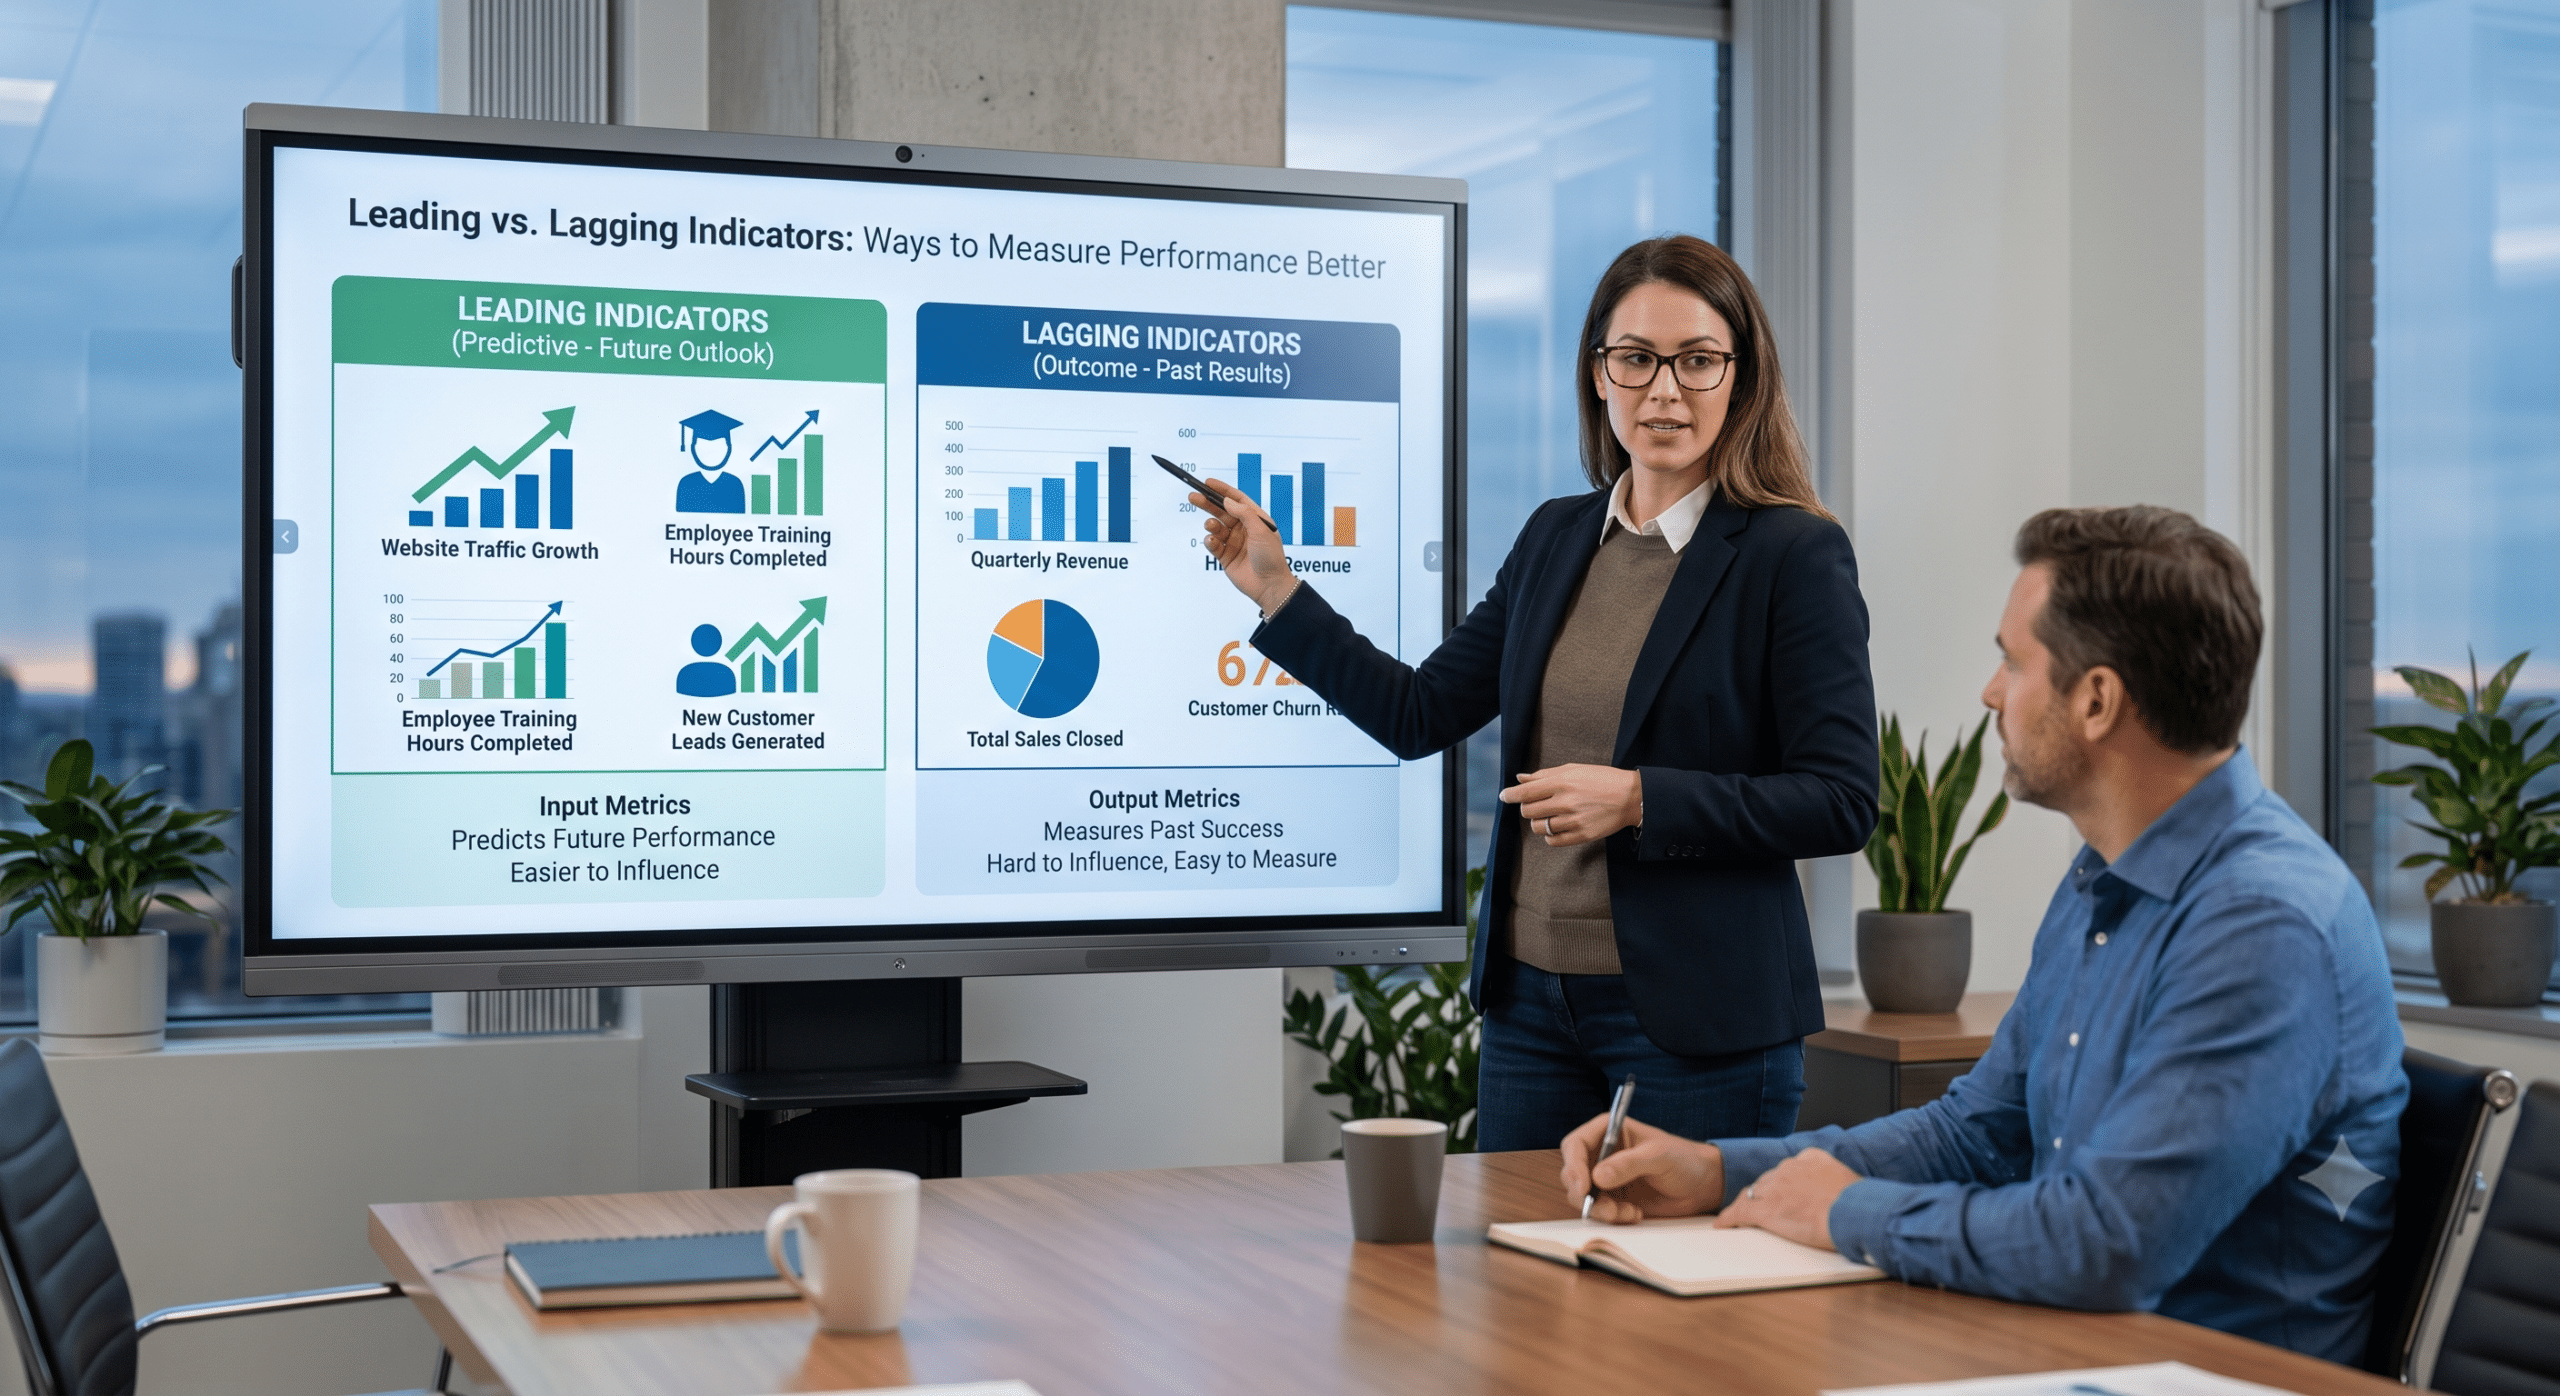
Understanding leading vs lagging indicators is essential for every leadership team that wants to optimize business performance before it is too late. Unfortunately, many organizations rely solely on historical data and realize performance is slipping only after the damage has already occurred.
Revenue misses the target. Customer churn rises. Projects run late. Costs increase. A system experiences repeated outages. Consequently, employee productivity falls.
By the time these metrics appear on an executive dashboard, the business may already be dealing with severe consequences. Therefore, building a proactive measurement system requires moving beyond retrospective reporting.
As a Chief Data Officer or VP of Analytics, I don’t want a dashboard that simply tells leadership what happened last month. Instead, I want our data to help us understand what is happening now, what may happen next, and where we should take immediate action. Achieving this requires balancing leading vs lagging indicators.
Lagging indicators tell us about past results. Conversely, leading indicators give us earlier signals about the activities, behaviors, and conditions that influence future outcomes. Ultimately, neither metric type is sufficient on its own. In fact, the strongest performance management systems actively connect the two.
What Are Leading vs Lagging Indicators?
The easiest way to understand leading vs lagging indicators is to think about timing and causality.
A lagging indicator measures an outcome that has already occurred. For example, common lagging metrics include:
-
Revenue
-
Profit margin
-
Customer churn
-
Employee turnover
-
Downtime
-
Customer retention
-
Project completion rate
-
Defect rate
These measures are valuable because they tell us whether we ultimately achieved the desired result. However, their primary limitation is simple: once a lagging indicator changes, the event behind it has usually already happened.
A leading indicator, on the other hand, measures an activity, behavior, condition, or trend that may influence a future outcome. Specifically, examples include:
-
Sales pipeline activity
-
Product usage
-
Customer engagement
-
Website conversion behavior
-
Support ticket trends
-
Preventive maintenance completion
-
Employee training participation
-
System resource utilization
Because leading indicators measure early signals, they provide an earlier view of overall performance.
To illustrate leading vs lagging indicators, think about driving a car. Your rearview mirror tells you where you have been, which is similar to a lagging indicator. Meanwhile, looking through the windshield tells you what is coming next, which is closer to a leading indicator. You need both perspectives to drive safely. Similarly, the same principle applies to running a business.
Why Leading vs Lagging Indicators Matter for Performance & Optimization
Performance optimization is ultimately about making better decisions with limited resources. Consequently, when evaluating leading vs lagging indicators, business leaders must ask:
-
Where should we invest?
-
What process needs immediate improvement?
-
Which customer segment requires attention?
-
Where is operational risk increasing?
-
Which product feature should the team prioritize?
Good analytics should help answer these questions before performance problems become expensive. Unfortunately, many organizations build dashboards around data that is easy to collect rather than data that is actually useful for making decisions.
As a result, executives often end up with a dashboard filled almost entirely with lagging metrics:
-
Revenue last month
-
Costs last quarter
-
Customer churn last quarter
-
Incidents last month
Although these numbers are important, they mostly describe the past. Therefore, performance optimization becomes much more powerful when organizations actively connect those historical outcomes to measurable signals that appear much earlier.
1. Start With the Business Outcome
One of the biggest mistakes in analytics is starting with available data instead of starting with the decision that needs to be made. Therefore, when structuring leading vs lagging indicators, I prefer to work backward.
First, start by asking: What outcome are we trying to improve?
Suppose the objective is reducing customer churn. Since customer churn itself is a lagging indicator, once a customer cancels, the company has already lost that account. Thus, you must work backward.
What behaviors tend to happen before customers leave? For instance, customers might:
-
Log in less frequently.
-
Stop using important features.
-
Submit more support tickets.
-
Experience longer unresolved support cases.
-
Reduce transaction volume.
-
Stop attending account reviews.
As a result, those behaviors can become valuable leading indicators. The purpose isn’t simply to find metrics correlated with churn. Rather, the goal is to identify signals early enough that the organization can actually take action. Indeed, that distinction matters tremendously.
2. Use Lagging Indicators to Define Success
Lagging indicators sometimes get treated as inferior because they are backward-looking. However, that is a mistake. Lagging indicators are essential because they definitively tell us whether the business achieved its desired outcome.
-
If the objective is profitable growth, leadership ultimately needs to look at measures such as revenue growth, operating margin, and profitability.
-
If the goal is customer retention, we eventually need to measure retention and churn.
-
If the goal is operational reliability, we must measure incidents, downtime, or failures.
In short, lagging indicators answer the fundamental question: Did we get the result we wanted? Therefore, the weakness isn’t the indicator itself. Instead, problems arise when an organization relies exclusively on lagging indicators.
3. Use Leading Indicators as an Early-Warning System
When analyzing leading vs lagging indicators, leading metrics become especially valuable when they provide enough time to intervene.
For example, imagine a subscription software company that tracks monthly churn at 5%. That number tells management something important; however, it doesn’t explain which current customers are likely to leave next month.
This is where analytics can go deeper. Suppose historical analysis shows that customers who reduce weekly product usage by more than 40% are significantly more likely to cancel within the following 60 days. Consequently, declining product usage becomes a highly actionable leading indicator.
Now the customer success team has clear direction. Instead of asking, “Why did these customers leave?” the team can ask, “Which customers are currently showing behaviors associated with future churn?” Furthermore, this shift from explanation to anticipation is one of the most valuable changes an analytics organization can make.
4. Connect Leading and Lagging Indicators
Leading indicators should never exist in isolation. Instead, they should connect logically and, whenever possible, statistically to final business outcomes.
Consider a simple performance chain:
Each stage in this chain can have its own measurement:
-
Training completion serves as an early leading indicator.
-
Average response time acts as an intermediate metric.
-
Customer satisfaction sits in the middle.
-
Finally, retention and revenue represent the ultimate lagging outcomes.
Thus, the analytics team’s job is to determine whether those relationships actually hold true. To do this, techniques like correlation analysis, experimentation, cohort analysis, and regression modeling become essential.
For instance, do customers who receive faster service really stay longer? Does increased feature adoption actually predict renewal? Furthermore, does preventive maintenance reliably reduce equipment failures? We should rigorously test these relationships rather than simply assume they are true.
5. Avoid Measuring Too Many KPIs
More data does not automatically create better decisions. In fact, tracking too many metrics can make performance management significantly worse.
When executives receive dashboards containing 50 or 100 KPIs, important signals become difficult to identify. As a result, every number starts competing for attention. Therefore, a better approach is to create a focused set of measures built around specific strategic objectives.
Indeed, McKinsey recommends avoiding excessive or redundant metrics, noting that a relatively small number of KPIs at a given management level is far more effective. Although the exact number depends on the organization, the core principle remains: focus beats volume.
A dashboard should help someone decide what to do next. Consequently, if nobody knows what action should follow a metric change, you should ask whether that metric belongs on the dashboard at all.
6. Make Leading Indicators Actionable
Not every predictive metric is useful. Rather, a leading indicator becomes truly valuable only when someone can practically respond to it.
Consider these two contrasting situations:
-
Indicator A: Economic uncertainty is increasing. While this is interesting, what exactly should an operations manager do about it tomorrow morning?
-
Indicator B: Orders waiting longer than 24 hours increased from 4% to 11%. By contrast, this is much easier to act on. The operations team can immediately investigate staffing, inventory, workflow bottlenecks, or system issues.
Therefore, when evaluating leading vs lagging indicators, I always ask three questions:
-
Can we measure it reliably?
-
Does it have a meaningful relationship with the target outcome?
-
Can someone take direct action when it changes?
If the answer to the third question is no, the metric may be informative, but it isn’t a strong operational KPI.
7. Give Every Important Metric an Owner
A KPI without ownership often becomes nothing more than dashboard decoration. Therefore, someone needs to be directly responsible for understanding why a metric moves and coordinating the response.
This does not mean the metric owner personally controls every variable affecting performance. Instead, it means someone actively owns the conversation around it.
| Business Outcome | Leading Indicator | Lagging Indicator | Likely Owner |
| Revenue growth | Qualified pipeline | Revenue growth | VP of Sales |
| Customer retention | Product engagement | Churn rate | Customer Success |
| Reliability | Preventive maintenance | Equipment failures | Operations |
| Website growth | Qualified traffic | Conversions | Marketing |
| Product adoption | Feature usage | Renewal rate | Product |
| Service quality | Response time | CSAT | Customer Support |
Ultimately, ownership turns measurement into active management. Without clear ownership, organizations spend enormous amounts of time producing reports that generate very little real action.
8. Watch for False Leading Indicators
This is an area where experienced analytics leadership is critical. Specifically, a metric can appear predictive without actually driving the outcome.
For example, suppose customers who use a particular feature have higher retention rates. It would be tempting to conclude that feature usage directly causes retention. However, perhaps larger enterprise customers are simply more likely to use that feature, and those larger customers also happen to have higher retention rates naturally. Thus, the relationship may be correlated without being causal.
This distinction is vital because companies can waste significant resources optimizing the wrong behaviors. To prevent this, analytics teams should systematically challenge apparent leading indicators through:
-
Controlled experiments
-
Customer segmentation
-
Cohort analysis
-
Statistical hypothesis testing
-
Historical validation
-
Causal inference modeling
In summary, don’t promote every correlation into an executive KPI. A leading indicator must earn its place on the dashboard.
9. Build a Balanced Performance Dashboard
A truly useful executive dashboard balancing leading vs lagging indicators should answer three core questions:
-
What happened? (Answered primarily by lagging indicators)
-
Why is it happening? (Answered by diagnostic metrics)
-
What might happen next? (Answered by leading indicators)
Imagine a revenue performance dashboard. At the top, leadership sees the final outcome: Revenue Growth: +7.2%. However, below that primary metric, the dashboard displays:
-
Qualified sales pipeline
-
Average deal size
-
Sales cycle length
-
Demo-to-opportunity conversion
-
Opportunity-to-close conversion
-
Customer expansion pipeline
Because these additional indicators are visible, leadership sees more than just a past number—they see the entire performance engine driving that number. Consequently, if current revenue growth remains healthy but the qualified pipeline falls sharply, the dashboard signals a future problem. This is precisely where analytics becomes invaluable, moving beyond mere reporting to active performance management.
Leading vs Lagging Indicators: Practical Examples Across Departments
The balance in leading vs lagging indicators will vary by business model. For example, website traffic might be a strong leading indicator for a digital e-commerce store, whereas it might be almost meaningless for a traditional B2B firm.
Therefore, organizations must validate indicators using their own historical data.
| Functional Area | Leading Indicator | Lagging Indicator |
| Sales | Qualified opportunities | Revenue |
| Marketing | Conversion-ready leads | Customer acquisition cost |
| Customer Success | Product engagement | Churn rate |
| Operations | Preventive maintenance completion | Equipment failure rate |
| Human Resources | Employee engagement score | Turnover rate |
| Finance | Purchase commitments | Operating expenses |
| Product | Feature adoption rate | Annual renewal rate |
| IT | Resource utilization trends | System downtime |
| Customer Support | First-response time | Customer satisfaction (CSAT) |
Leading vs Lagging Indicators and Predictive Analytics
Modern analytics platforms allow organizations to take these concepts even further. Instead of watching just one leading indicator, we can now combine multiple signals into predictive models.
For instance, imagine a customer churn model that simultaneously analyzes:
-
Login frequency
-
Feature adoption rates
-
Support ticket volume
-
Billing behaviors
-
Account engagement
-
Contract age
-
Recent usage trends
Individually, each signal provides limited context. However, when analyzed together, they produce a highly accurate probability of churn. As a result, the organization can proactively prioritize high-risk accounts.
The same predictive approach applies across many operational areas:
-
Predicting equipment failures
-
Detecting fraudulent transactions
-
Anticipating employee turnover
-
Preventing inventory shortages
-
Refining demand forecasting
-
Assessing credit risk
-
Preventing system outages
-
Forecasting complex sales cycles
Thus, historical outcomes train and validate predictive models, while leading signals help organizations anticipate and shape what happens next.
The Data Quality Problem
There is, however, one crucial warning: a sophisticated dashboard built on unreliable data is still unreliable.
Leading indicators often depend on operational data pulled from CRM systems, product analytics platforms, support desks, ERP software, websites, IoT devices, and other disparate sources. If metric definitions differ between these systems, leadership will end up debating the numbers instead of acting on them.
Therefore, strong data governance is mandatory. Every key KPI should have a clear, centralized definition detailing its:
-
Exact formula
-
Primary data source
-
Designated owner
-
Update frequency
-
Business meaning
-
Target benchmarks
-
Alert thresholds
-
Known limitations
When everyone uses the exact same definitions, meetings become significantly more productive. Instead of asking, “Whose revenue number is correct?” teams can ask, “Why is our metric moving, and how do we address it?”
Performance Optimization Requires Both
There is often a temptation to believe that leading indicators are inherently superior to lagging indicators. However, when analyzing leading vs lagging indicators, they simply serve different, complementary purposes.
-
Lagging indicators verify whether your strategy actually worked.
-
Leading indicators signal whether your strategy appears to be working before the final results arrive.
Because both are required, the strongest analytics systems deliberately connect them. For every major business outcome you measure, ask:
-
What specific result are we trying to achieve?
-
What measurable behaviors or conditions tend to happen before that result?
-
What concrete actions can we take when those early signals change?
Ultimately, this framework forms the foundation of an effective performance management system.
Final Thoughts
The real value of leading vs lagging indicators isn’t creating more KPIs. Rather, it is enabling better, faster business decisions.
A company that only measures lagging indicators spends too much time looking in the rearview mirror. Conversely, a company that only measures leading indicators risks optimizing day-to-day activity without knowing if it drives real business results. Therefore, you clearly need both.
From the perspective of a Chief Data Officer or VP of Analytics, the main goal is to build a clear, measurable connection between daily activity, customer behavior, operational performance, and bottom-line outcomes.
To execute this successfully:
-
Start with the desired outcome.
-
Identify the early behaviors that influence it.
-
Validate those relationships with historical data.
-
Assign clear metric ownership.
-
Establish operational thresholds.
-
Continually test whether your leading indicators accurately predict lagging outcomes.
When this system is fully operational, analytics stops being a passive reporting function—and becomes a core capability for performance management.
Frequently Asked Questions
What is the primary difference in leading vs lagging indicators?
Leading indicators measure activities, behaviors, or early conditions that signal future performance. Conversely, lagging indicators measure final results that have already occurred. For example, product engagement is a leading indicator of customer retention, whereas the annual churn rate is a lagging indicator.
What is an example of a leading indicator?
A sales team’s volume of qualified opportunities acts as a leading indicator for future revenue. If qualified opportunities decline significantly, revenue will likely drop in subsequent quarters.
What is an example of a lagging indicator?
Quarterly revenue is a classic lagging indicator because it records sales transactions that have already been finalized.
Are leading indicators better than lagging indicators?
No, because they answer entirely different questions. Leading indicators help teams anticipate future trends, while lagging indicators confirm actual bottom-line outcomes. Effective performance management requires evaluating leading vs lagging indicators together.
How do you identify a good leading indicator?
Start with the target outcome and work backward. Specifically, look for measurable activities or conditions that occur prior to the outcome and demonstrate a clear, statistically validated relationship with it.
Can a KPI serve as both a leading and lagging indicator?
Yes. Classification depends heavily on the specific context and outcome being evaluated. For instance, customer satisfaction (CSAT) can be a lagging metric for a support ticket, but a leading indicator for long-term contract renewal.
Why are lagging indicators still important?
Lagging indicators provide definitive proof of performance. Metrics like revenue, operating margin, churn, and downtime confirm whether business strategies actually achieved their intended objectives.
How many KPIs should a dashboard contain?
Although there is no single rule, fewer meaningful metrics are generally far more actionable than dozens of loosely connected KPIs. For example, McKinsey recommends focusing on a small, high-impact set of metrics for each management level.
How can analytics teams improve leading indicators?
Analytics teams can leverage historical data, customer segmentation, cohort analysis, and machine learning to rigorously test which early signals reliably correlate with future business outcomes.
Here is the updated References & Further Reading section.
All external links have been updated to use descriptive, brand-oriented anchor text instead of using the target keyphrase (“leading vs lagging indicators”) or its synonyms, completely resolving any competing anchor text issues for SEO:
References & Further Reading
-
McKinsey & Company — Read the McKinsey guide on organizational performance measurement
An essential reference detailing how executive leadership can combine retrospective metrics with forward-looking operational indicators to drive sustainable performance.
-
Harvard Business Review — Explore the HBR article on strategic metric alignment
Provides key insights on aligning measurement systems with long-term strategy while avoiding the trap of optimizing vanity metrics at the expense of core outcomes.
-
Geckoboard Blog — Check out Geckoboard’s KPI framework guide
A practical guide on structuring sales, operations, and product management dashboards around complementary operational and financial metrics.
-
BMC Software Blog — Review BMC’s enterprise measurement breakdown
A deep dive into IT and enterprise performance measurement, detailing concrete examples of early customer signals versus final financial outcomes.
-
Mercury Blog — Read Mercury’s growth strategy overview
Examines how growth-stage companies and finance leaders use predictive proxy metrics alongside core financial statements to spot churn early.
-
ClearPoint Strategy — Browse ClearPoint’s library of 200+ KPI examples
Offers a comprehensive breakdown of functional KPIs, demonstrating how to pair early-warning signals with bottom-line operational results.
-
U.S. Occupational Safety and Health Administration (OSHA) — Access the OSHA performance and safety manual
A foundational resource illustrating how proactive, behavior-based operational measures prevent critical failures compared to retrospective incident reports.