
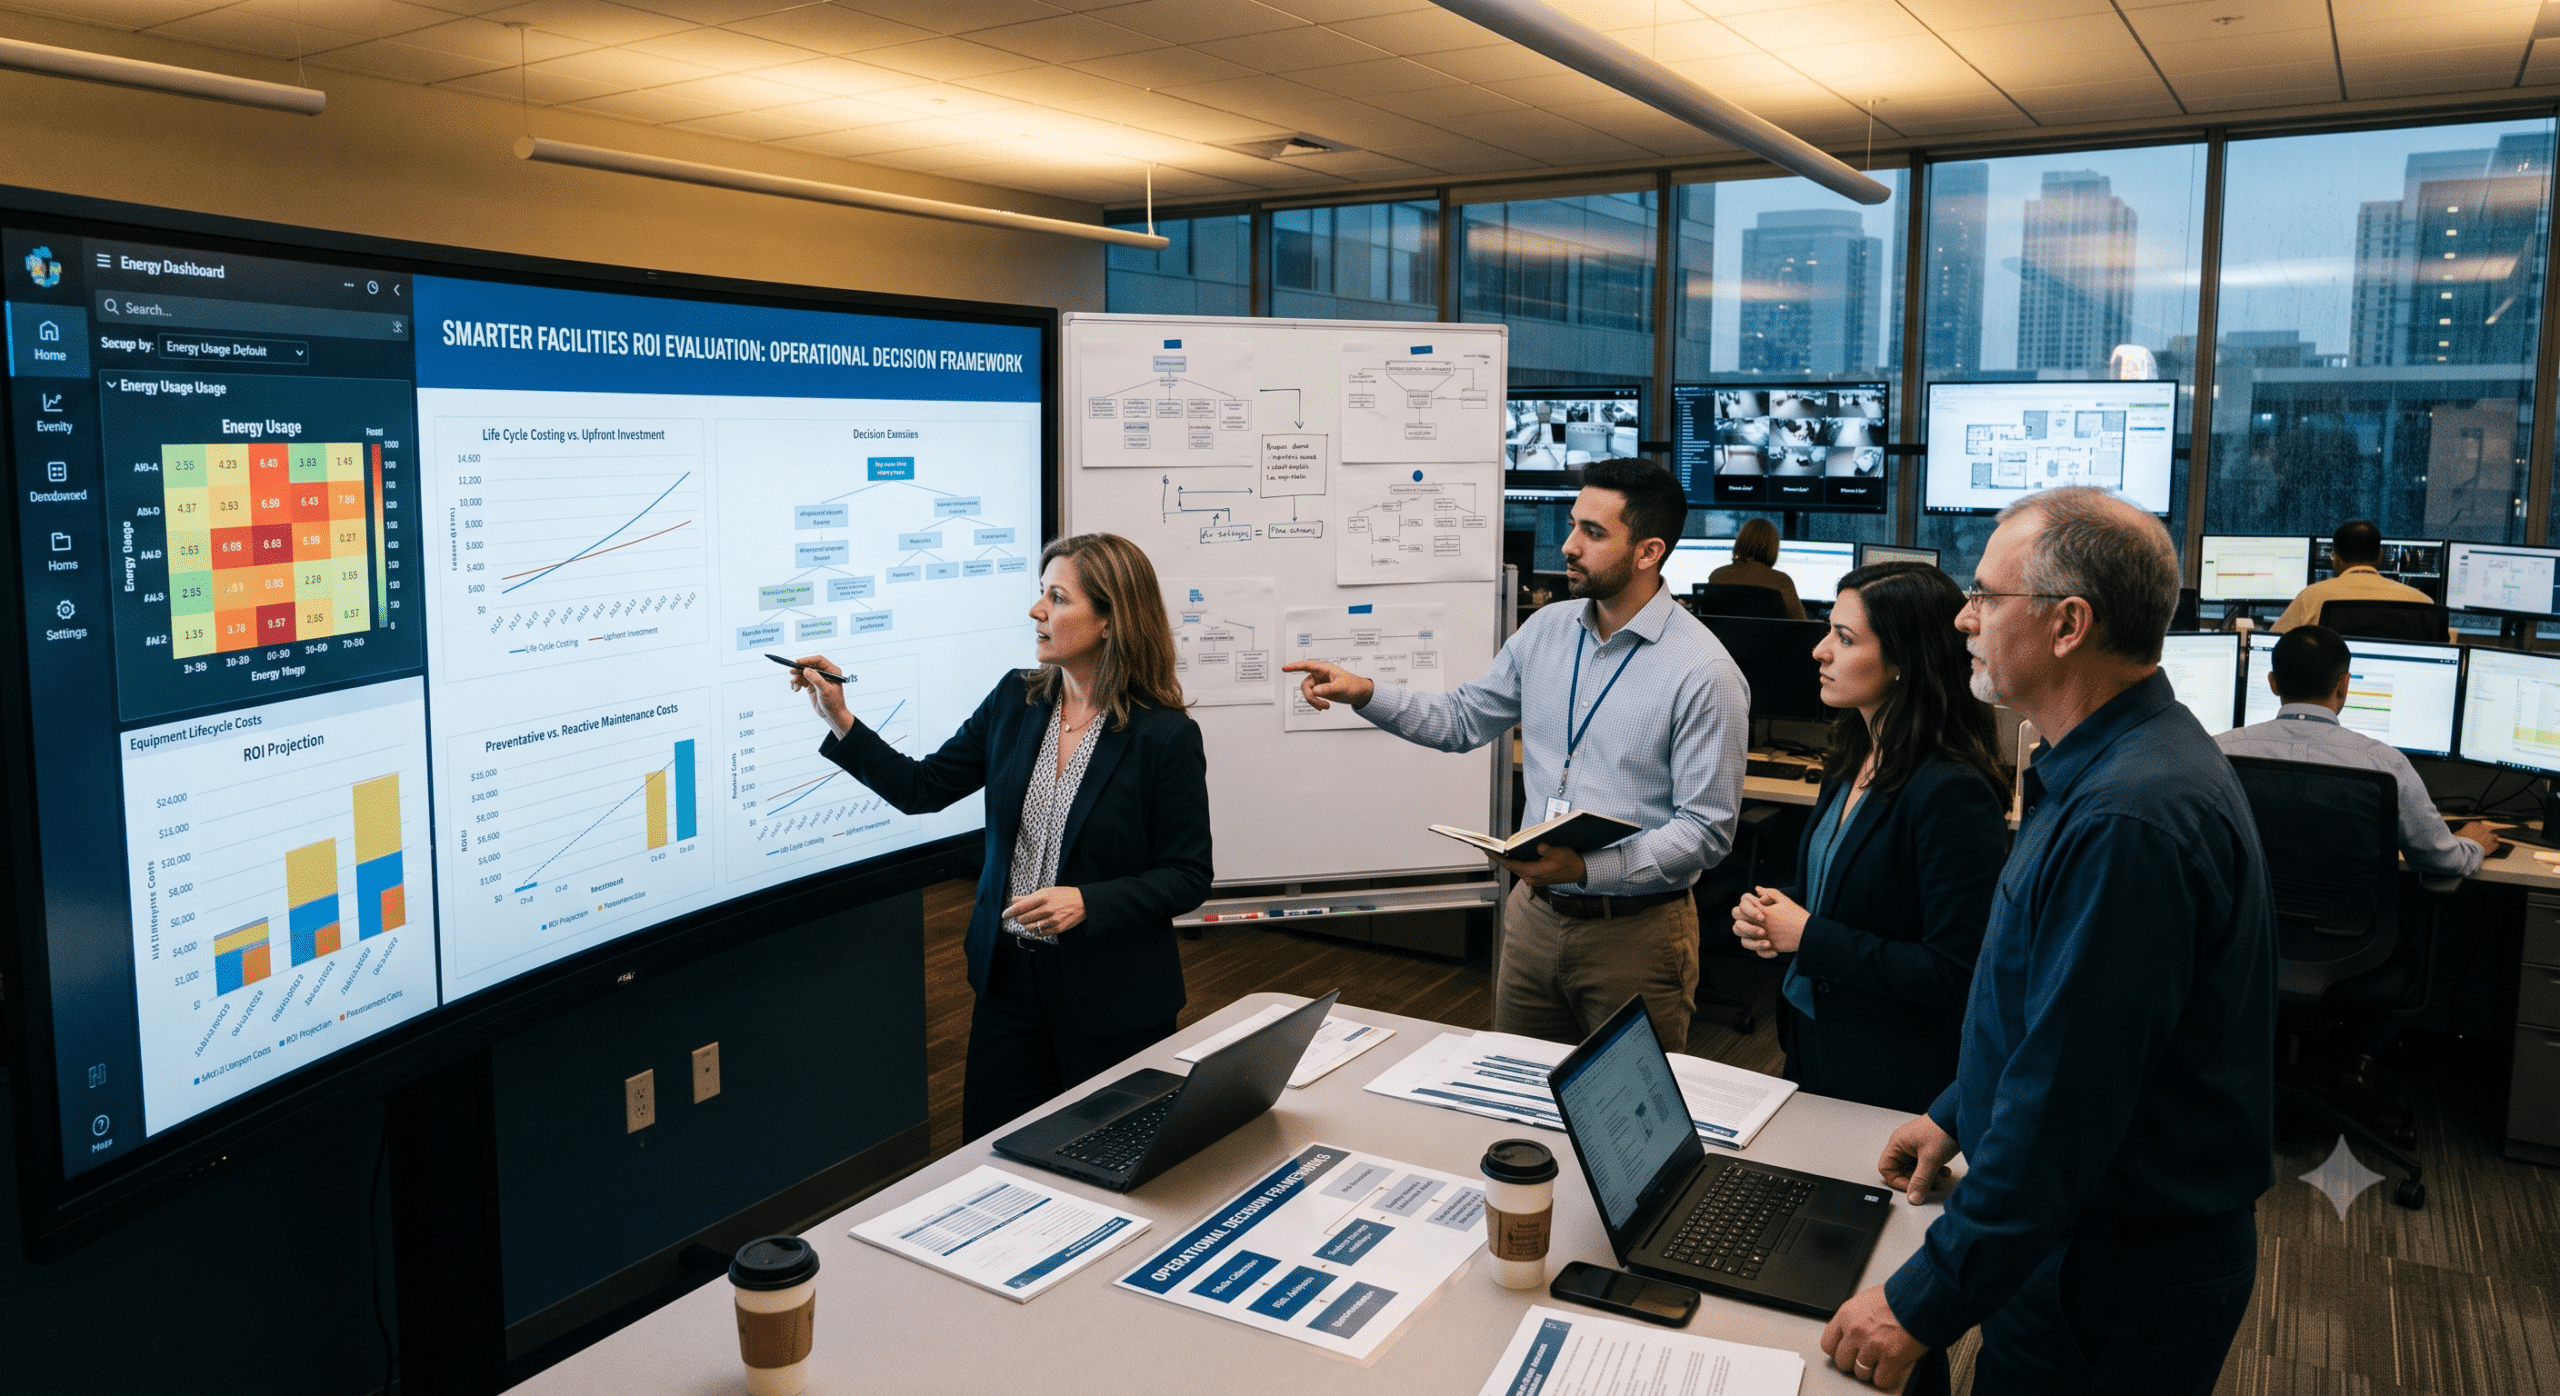
If you have spent more than five minutes in a boardroom trying to pitch a capital upgrade for a building, consequently, you already know the look. Achieving an accurate Facilities ROI evaluation is critical when presenting a compelling 20-page deck on why your facility needs a new chiller plant, a modernized HVAC automation system, or an integrated workplace management platform. Specifically, you talk about equipment lifecycle, baseline pressure drops, and thermal efficiency.
However, the Chief Financial Officer looks up from their laptop and asks one simple question: “What is our precise Facilities ROI evaluation, and when do we get our money back?”
For decades, facilities management and executive leadership have operated on two completely different wavelengths. On one hand, facilities teams speak the language of physical uptime, mean time between failures (MTBF), square footage, and preventive maintenance completion rates. On the other hand, executives speak the language of EBITDA, capital allocation, risk mitigation, and internal rate of return (IRR).
When these two worlds fail to connect, as a result, good projects die in committee. Furthermore, critical infrastructure gets deferred until a catastrophic failure forces an emergency spend at triple the cost.
As consultants working at the intersection of facilities management and operations strategy, therefore, we see this breakdown every single week. The fix isn’t to ask for bigger budgets or complain about “short-sighted” finance teams. Instead, the fix is to deploy a standardized Operational Decision Framework built specifically for Facilities ROI evaluation.
What Is an Operational Decision Framework?
An operational decision framework is a structured, repeatable model that translates physical operational choices into quantified business outcomes. Ultimately, it removes emotional guesswork, gut feelings, and fragmented spreadsheets from capital allocation decisions.
Rather than evaluating building projects as isolated expense items, an operational decision framework forces every request through a multi-layered evaluation funnel. Thus, it ties physical assets directly to organizational performance, cost reduction, risk management, and overall business value.
+-----------------------------------------------------------------------+
|                    OPERATIONAL DECISION FRAMEWORK                     |
+-----------------------------------------------------------------------+
|  1. Data Ingestion    -> Baseline cost, energy, space, asset health   |
|  2. Financial Mapping -> CapEx, OpEx, NPV, Payback, TCO calculation   |
|  3. Risk Scoring      -> Failure probability, business impact rating  |
|  4. Strategic Alignment-> Sustainability, employee experience, growth |
|  5. Decision Execution-> Prioritized capital project approval         |
+-----------------------------------------------------------------------+
When you use an operational decision framework, for instance, a request to replace an aging boiler system is no longer just “maintenance spending.” Instead, it becomes a risk-mitigated portfolio investment that yields an 18% annual return through energy savings, avoids $150,000 in emergency repair exposure, and extends building asset life by eight years.
Why Traditional Facilities ROI Evaluation Falls Short
Most traditional approaches to calculating facility ROI are far too narrow. Typically, they look at a single direct input and output—for example:
While this math works for a basic light-bulb swap, nevertheless, it utterly fails when applied to complex operational ecosystems. Facilities do not exist in a vacuum. In fact, a physical space directly influences employee retention, energy usage, regulatory compliance, brand reputation, and worker productivity.
Therefore, when facility managers execute a Facilities ROI evaluation purely through the lens of direct labor or immediate utility reductions, in turn, they leave up to 60% of the true financial return off the ledger.
                      TRADITIONAL vs. MODERN ROI

      Traditional View                      Modern Framework
   +--------------------+               +-----------------------+
   | - Direct Cost      |               | - Direct Cost         |
   | - Utility Savings  |               | - Utility Savings     |
   |                    |   VS.         | - Space Optimization  |
   |                    |               | - Risk Avoidance      |
   |                    |               | - Labor Productivity  |
   |                    |               | - Asset Longevity     |
   +--------------------+               +-----------------------+
The 5-Pillar Model for Facilities ROI Evaluation
To capture the complete financial picture, moreover, we implement a 5-Pillar Framework across client portfolios. Every capital proposal or operational process change must accordingly be evaluated against these five value layers to complete a rigorous Facilities ROI evaluation.
                       +-------------------------+
                       |   5-PILLAR EVALUATION   |
                       +-------------------------+
                                    |
       +-----------------+----------+----------+-----------------+
       |                 |                     |                 |
+--------------+  +--------------+      +--------------+  +--------------+
| 1. Direct    |  | 2. Space     |      | 3. Risk &    |  | 4. Energy &  |
|    Cost      |  |    Util.     |      |    Continuity|  |    Sustain.  |
+--------------+  +--------------+      +--------------+  +--------------+
                                    |
                            +---------------+
                            | 5. Human Cap. |
                            |    & Prod.    |
                            +---------------+
Pillar 1: Direct Cost Abatement & Asset Longevity
This is the baseline layer. Specifically, it measures the concrete dollars saved on parts, vendor fees, emergency call-out premiums, and manual labor hours.
-
Preventive vs. Reactive Ratios: First, moving from reactive repairs to predictive maintenance drops overall repair costs significantly.
-
Total Cost of Ownership (TCO): Second, extending asset useful life defers capital replacement expenditures across future financial periods.
Pillar 2: Space Optimization & Real Estate Footprint
Space is typically an organization’s second-highest overhead expense behind payroll.
-
Occupancy & Density Realities: For example, utilizing sensor technology and badge data reveals actual spatial usage versus perceived occupancy.
-
Square Footage Rationalization: Consequently, consolidating underutilized floors or subleasing unused footprint directly reduces rent, janitorial overhead, and HVAC balancing costs.
Pillar 3: Risk Mitigation & Business Continuity
What is the cost of doing nothing? This pillar monetizes operational failure risks.
-
Downtime Exposure: Indeed, a failure in facility systems (such as data center cooling or cleanroom ventilation) halts revenue-generating operations.
-
Regulatory & Safety Compliance: Additionally, fines, insurance premium hikes, and legal exposure resulting from non-compliant building practices are directly factored into the equation.
Pillar 4: Energy Management & Sustainability Yields
Utility bills represent one of the most volatile variables in facility operations.
-
Peak Demand Management: In particular, lowering peak energy usage reduces utility ratchets and utility demand charges.
-
Decarbonization & Building Value: As a result, energy-efficient assets carry higher market valuations, lower operating expenses, and qualify for green rebates or tax incentives.
Pillar 5: Human Capital & Productivity Impact
The physical environment dictates how people perform.
-
Indoor Environmental Quality (IEQ): For instance, proper ventilation, thermal comfort, and lighting levels reduce absenteeism and increase cognitive output.
-
Talent Attraction and Retention: Furthermore, modern, well-maintained facilities serve as physical recruiting tools, lowering costly employee turnover.
The Operational Decision Framework Step-by-Step
Implementing this framework requires a deliberate process. Hence, here is how we guide client teams through a structured evaluation lifecycle:
+-------------------------------------------------------------------------+
|                  OPERATIONAL DECISION PROCESS FLOW                      |
+-------------------------------------------------------------------------+
| Step 1: Baseline Audit (Establish physical & financial truth)           |
| Step 2: Financial Translation (Apply TCO, NPV, and discount rates)     |
| Step 3: Risk-Weighted Modeling (Factor in downtime & failure rates)     |
| Step 4: Decision Matrix Execution (Score against strategic priorities) |
| Step 5: Post-Implementation Audit (Verify actual vs. estimated ROI)     |
+-------------------------------------------------------------------------+
Step 1: Baseline Data Audit
To begin with, you cannot measure improvement without knowing your starting point. Gather 12 to 24 months of historical data across work order logs, utility bills, floor plans, vendor contracts, and asset register condition scores.
Step 2: Financial Translation
Next, convert physical improvements into financial formulas acceptable to corporate finance. Specifically, use standard formulas for Net Present Value (NPV), Internal Rate of Return (IRR), and Total Cost of Ownership (TCO):
Where:
-
$CF_t$ = Net cash flow generated by facility improvements during time period $t$
-
$r$ = Discount rate / hurdle rate set by executive leadership
-
$t$ = Time period (years)
-
$C_0$ = Initial CapEx outlay
Step 3: Risk-Weighted Scenario Modeling
Every decision carries risk. Therefore, run three operational scenarios for every capital proposal:
-
Status Quo (Do Nothing): Model the compounding costs of deferred maintenance, energy degradation, and expected asset failure probabilities.
-
Standard Modernization: Basic replacement with high-efficiency standard equipment.
-
Advanced Smart Integration: Full IoT integration with predictive analytics, automated diagnostics, and spatial sensors.
Step 4: Multi-Criteria Decision Matrix Execution
Afterwards, score proposals using a weighted matrix that balances financial return, risk score, operational urgency, and strategic alignment.
| Evaluation Criteria | Weight (%) | Project A: Boiler Upgrade | Project B: Smart Lighting |
| Financial ROI (NPV) | 30% | 8/10 | 6/10 |
| Risk Avoidance | 25% | 9/10 | 3/10 |
| Energy Efficiency | 20% | 7/10 | 8/10 |
| User Experience | 15% | 4/10 | 9/10 |
| Implementation Speed | 10% | 5/10 | 9/10 |
| Weighted Total Score | 100% | 7.15 | 6.65 |
Step 5: Post-Implementation Auditing
Finally, an evaluation framework is incomplete without accountability. Thus, track actual performance against projections 6, 12, and 24 months after execution to refine future financial models.
15 Essential Metrics for Facilities ROI Evaluation
To build a reliable operational framework, in addition, you need to track the right data. In our consulting practice, we recommend tracking 15 core operational indicators grouped into four clear operational categories to conduct a comprehensive Facilities ROI evaluation:
                  15 CORE FACILITIES ROI METRICS

   Financial            Operational         Spatial            Human
  +---------------+    +---------------+   +---------------+  +---------------+
  | 1. OpEx / SqFt|    | 5. MTBF       |   | 9. Space Util.|  |13. Occupant   |
  | 2. FCI        |    | 6. MTTR       |   |10. Vacancy Rate  | Sat. Score    |
  | 3. TCO        |    | 7. PM vs RM % |   |11. Cost / Desk|  |14. First-Time |
  | 4. Budget Var.|    | 8. SLA Rate   |   |12. Peak Density  | Fix Rate      |
  +---------------+    +---------------+   +---------------+  |15. Air Quality|
                                                              +---------------+
Financial & Capital Metrics
-
Operating Cost per Square Foot: $\frac{\text{Total Facility Operating Spend}}{\text{Total Managed Square Feet}}$
-
Facility Condition Index (FCI): $\frac{\text{Total Deferred Maintenance Costs}}{\text{Asset Replacement Value}}$ (A lower index indicates better health).
-
Total Cost of Ownership (TCO): Capital expense plus lifetime operating, energy, and maintenance costs minus residual salvage value.
-
Budget Variance Percentage: $\frac{\text{Actual Spend} – \text{Budgeted Spend}}{\text{Budgeted Spend}} \times 100$
Operational & Asset Performance Metrics
-
Mean Time Between Failures (MTBF): $\frac{\text{Total Operational Hours}}{\text{Number of Equipment Failures}}$
-
Mean Time to Repair (MTTR): $\frac{\text{Total Maintenance Downtime Hours}}{\text{Number of Repairs}}$
-
Preventive vs. Reactive Maintenance Ratio: In general, target an 80/20 split between planned preventive care and reactive work.
-
SLA Compliance Rate: Percentage of work orders completed within agreed response time windows.
Spatial Efficiency Metrics
-
Space Utilization Rate: $\frac{\text{Actual Peak Occupancy}}{\text{Total Designed Capacity}} \times 100$
-
Vacancy Rate by Space Type: Unused dynamic workspaces versus fixed workstations over a specified timeframe.
-
Cost per Desk / Workspace: $\frac{\text{Total Real Estate Spend}}{\text{Active Workstations}}$
-
Peak Spatial Density: Maximum concurrent occupants measured via physical badge and sensor integrations.
Human Capital & Experience Metrics
-
Occupant Satisfaction Score: Qualitative user feedback collected through modern workplace platforms.
-
First-Time Fix Rate: Percentage of service requests resolved on the initial technician visit without callbacks.
-
Indoor Environmental Quality Index: Consolidated metrics measuring carbon dioxide levels, humidity, lighting levels, and airflow rates.
Real-World Case Studies: Applying the Framework
Case Study A: HVAC Retro-Commissioning vs. Capital Replacement
The Situation: An enterprise client operating a 15-story suburban office complex faced rising utility costs and frequent tenant temperature complaints. In response, the onsite building engineer requested $850,000 to completely replace two aging central chillers.
Applying the Framework:
However, instead of rubber-stamping an $850,000 capital outlay, the leadership team put the project through an operational decision framework to perform a proper Facilities ROI evaluation for alternative solutions.
+--------------------------------------------------------------------------+
|                      CASE STUDY A COMPARISON SUMMARY                     |
+--------------------------------------------------------------------------+
| Option 1: Full Chiller Replacement                                       |
| - Upfront CapEx: $850,000                                                |
| - Implementation Time: 9 Months                                          |
| - Payback Period: 8.2 Years                                              |
|                                                                          |
| Option 2: Retro-Commissioning + Predictive Controls (Chosen)             |
| - Upfront CapEx: $140,000                                                |
| - Implementation Time: 2 Months                                          |
| - Payback Period: 1.1 Years                                              |
+--------------------------------------------------------------------------+
-
Direct Audit: First, the audit revealed that the chillers had structural integrity, but the control sequences were outdated. Consequently, valves were leaking and air handling unit dampers were stuck open.
-
Alternative Evaluation: Next, the team evaluated a $140,000 retro-commissioning project paired with modern cloud-based control sensors, comparing it against the full $850,000 replacement.
-
Financial Output:
-
Full Replacement: $850,000 CapEx, estimated annual energy saving of $103,000 (Payback: 8.2 years).
-
Retro-Commissioning: $140,000 CapEx, estimated annual energy saving of $122,000 (Payback: 1.1 years).
-
-
The Outcome: Ultimately, the framework steered leadership to retro-commissioning. As a result, the project achieved full payback in 13 months and freed up $710,000 in capital for critical roof repairs.
Case Study B: Space Rationalization in a Hybrid Work Environment
The Situation: A corporate headquarters was maintaining 200,000 square feet across four leased floors. Meanwhile, post-hybrid policy implementation, badge swipe data showed daily peak attendance never exceeded 45% of capacity.
+--------------------------------------------------------------------------+
|                  CASE STUDY B: SPACE RATIONALIZATION                     |
+--------------------------------------------------------------------------+
| - Total Managed Space: 200,000 SqFt (4 Floors)                           |
| - Actual Peak Occupancy: 45%                                             |
| - Action Taken: Terminated lease on 1 floor (50,000 SqFt reduction)       |
| - Spatial Tech Investment: $180,000 (Desk booking & sensor platform)     |
| - Net Annual Savings: $1.15 Million                                      |
| - First-Year Net ROI: 538%                                               |
+--------------------------------------------------------------------------+
Applying the Framework:
The operations team used spatial metrics and TCO calculations in order to reframe the lease renewal strategy.
-
Quantifying Spatial Waste: At $32 per square foot, the underutilized space represented roughly $1.4 million in annual wasted rent, cleaning, and power costs.
-
Executing the Framework: Consequently, the company spent $180,000 implementing desk-booking technology, modernizing hot-desking setups, and installing occupancy sensors. This, in turn, enabled them to surrender an entire 50,000-square-foot floor upon lease renewal.
-
The ROI Calculation:
-
Direct Annual Lease & Operating Savings: $1,600,000
-
One-time Tech & Reconfiguration Cost: $270,000
-
Ongoing Tech SaaS Cost: $35,000/year
-
First-Year Net ROI:
-
3 Fatal Pitfalls to Avoid in Facilities ROI Evaluation
Over our years consulting for enterprise organizations, meanwhile, we regularly spot the same three structural errors when management teams perform a Facilities ROI evaluation:
+--------------------------------------------------------------------------+
|                         THREE FATAL ROI PITFALLS                         |
+--------------------------------------------------------------------------+
| 1. Initial CapEx Bias       -> Ignoring lifetime maintenance and energy  |
| 2. Siloed Data Systems      -> Keeping CMMS isolated from ERP & HR      |
| 3. Omitting Risk Costs      -> Failing to monetize operational failure   |
+--------------------------------------------------------------------------+
1. Falling into the “Upfront Price Tag” Trap
Focusing strictly on initial acquisition cost instead of Total Cost of Ownership leads to poor capital decisions. For instance, buying a low-cost rooftop unit saved $15,000 upfront on paper, but cost an extra $8,000 per year in electricity while failing three years early. Therefore, always evaluate assets over their entire useful life.
2. Operating with Siloed Systems
If your Computerized Maintenance Management System (CMMS) doesn’t talk to your Enterprise Resource Planning (ERP) platform or HR tools, as a result, your data is incomplete. Conversely, unified data systems reveal the true connection between facility maintenance, energy costs, employee output, and administrative overhead.
3. Ignoring the “Cost of Doing Nothing”
When finance declines an operational request, moreover, they often view “doing nothing” as costing $0. In reality, doing nothing is rarely free. Deferred maintenance creates compounding operational risk, higher utility consumption, and accelerated asset failure. Thus, always include the financial penalty of the status quo in your baseline models.
Step-by-Step Template for Executive Business Cases
When presenting facility proposals to executive leadership, therefore, organize your business case using this clear structure:
============================================================================
                     CAPITAL PROPOSAL EXECUTIVE BRIEF
============================================================================

1. EXECUTIVE SUMMARY
   - Core Problem: Aging critical asset / inefficiency / space underutilization
   - Proposed Solution: Project description & implementation timeline
   - Financial Summary: Investment cost, expected savings, NPV, and payback period

2. OPERATIONAL IMPACT & PILAR ANALYSIS
   - Direct Financial Savings (Maintenance, Labor, Materials)
   - Energy & Utility Reductions
   - Risk Avoidance & Downtime Mitigation
   - Spatial & Employee Productivity Gains

3. FINANCIAL MODEL & SCENARIO ANALYSIS
   - Base Case vs. Do-Nothing Case vs. Advanced Integration
   - Cash Flow Table (Years 1 to 5)
   - Net Present Value (NPV) & Payback Calculations

4. RISK MANAGEMENT & EXECUTION PLAN
   - Project milestones, vendor governance, and risk mitigation tactics

5. POST-IMPLEMENTATION AUDIT COMMITMENT
   - Schedule for verifying projected savings (6, 12, 24-month reviews)

============================================================================
Frequently Asked Questions (FAQ)
How do you calculate facilities ROI when soft benefits like employee productivity are hard to measure?
First, focus on direct, hard-dollar savings like utility drops, contract consolidations, and reduced repair fees. Then, treat soft benefits (such as improved indoor air quality increasing productivity) as qualitative upside multipliers rather than core justification points. Indeed, if hard savings cover the project cost, productivity gains become pure extra value.
What is an acceptable payback period for facility investments?
In corporate operations, generally, standard payback thresholds range between 2 and 4 years for technology, lighting, and energy controls. On the other hand, for heavy infrastructure assets like central boilers, chillers, or roofs, payback timelines often stretch to 7 to 10 years due to their extended 20-plus-year operational lifespans.
What is the difference between CMMS, CAFM, and IWMS?
-
CMMS (Computerized Maintenance Management System): Focuses primarily on work orders, asset maintenance histories, and parts inventory.
-
CAFM (Computer Aided Facility Management): In addition, adds floor plan mapping, physical space tracking, and move management capabilities.
-
IWMS (Integrated Workplace Management System): Ultimately, unifies maintenance, space, real estate leases, capital project planning, and energy tracking into a single enterprise platform.
How do I convince my CFO to fund deferred maintenance?
Frame deferred maintenance as a calculated business risk with a compounding interest rate. Specifically, use the Facility Condition Index (FCI) to show how delaying a $50,000 repair today leads to an emergency $200,000 replacement tomorrow, complete with lost operational revenue from unplanned building downtime.
References & Further Reading
- IFMA – How Facility Managers Can Prove Strategic Value
Explains how facility managers can demonstrate measurable business value by aligning operational decisions with organizational goals, using performance metrics, ROI, and strategic planning. - IFMA FMJ – Strategic Infrastructure Decisions
Describes a practical framework for evaluating facility investments through lifecycle assessment, scenario modeling, risk analysis, and long-term capital planning. - IFMA Knowledge Library – Optimizing Building Management with a Lifecycle Approach
Discusses how lifecycle thinking improves operational decision-making by reducing long-term costs, extending asset life, and supporting sustainable facility management. - IFMA Knowledge Library – Bridging Data & Decision-Making in Facilities Management
Shows how CAFM and asset data can be transformed into actionable insights for predictive maintenance, operational planning, and evidence-based facility decisions. - IFMA Knowledge Library – Operational and Capital Budgeting
A collection of white papers and articles covering operational budgeting, capital investment planning, preventive maintenance, and financial decision-making for facility leaders.